使用堆分析器
🌐 Using Heap Profiler
堆分析器在 V8 之上运行,用于随时间捕获分配情况。在本文档中,我们将介绍使用以下方法进行内存分析:
🌐 The heap profiler acts on top of V8 to capture allocations over time. In this document, we will cover memory profiling using:
- 分配时间表
- 采样堆分析器
与在《使用堆快照》指南中介绍的堆转储不同,使用实时分析的目的是了解一段时间内的内存分配情况。
🌐 Unlike heap dumps which were covered in the Using Heap Snapshot guide, the idea of using real-time profiling is to understand allocations over a period of time.
堆分析器 - 分配时间线
🌐 Heap Profiler - Allocation Timeline
堆分析器类似于采样堆分析器,只是它会跟踪每一次分配。它的开销比采样堆分析器更大,因此不建议在生产环境中使用。
🌐 Heap Profiler is similar to the Sampling Heap Profiler, except it will trace every allocation. It has higher overhead than the Sampling Heap Profiler so it’s not recommended to use in production.
你可以使用 @mmarchini/observe 来以编程方式启动和停止性能分析器。
如何
🌐 How To
启动应用:
🌐 Start the application:
node --inspect index.js对于脚本来说,
--inspect-brk是更好的选择。
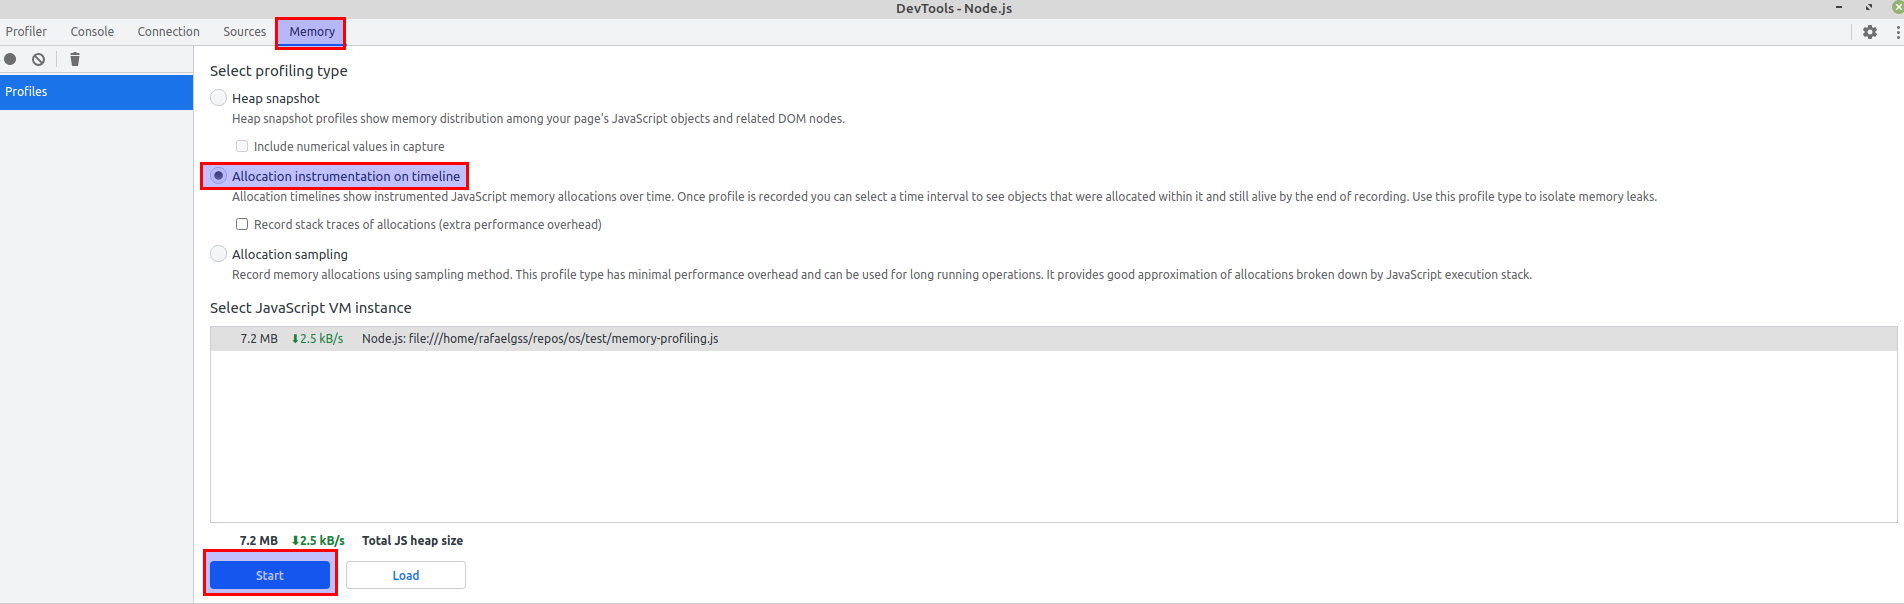
连接到 chrome 中的 dev-tools 实例,然后:
🌐 Connect to the dev-tools instance in chrome and then:
- 选择
Memory标签。 - 选择
Allocation instrumentation timeline。 - 开始分析。
一旦堆内存分析运行,强烈建议进行采样以识别内存问题。例如,如果我们正在对一个 web 应用进行堆内存分析,我们可以使用 Apache Benchmark 来生成负载:
🌐 Once the heap profiling is running, it is strongly recommended to run samples
in order to identify memory issues. For example, if we were heap profiling a
web application, we could use Apache Benchmark to produce load:
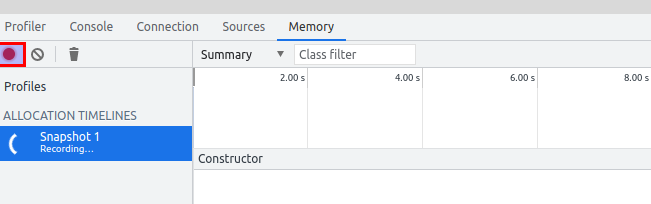
$ ab -n 1000 -c 5 http://localhost:3000然后,在加载完成后按停止按钮:
🌐 Then, press stop button when the load is complete:
最后,查看快照数据:
🌐 Finally, look at the snapshot data:
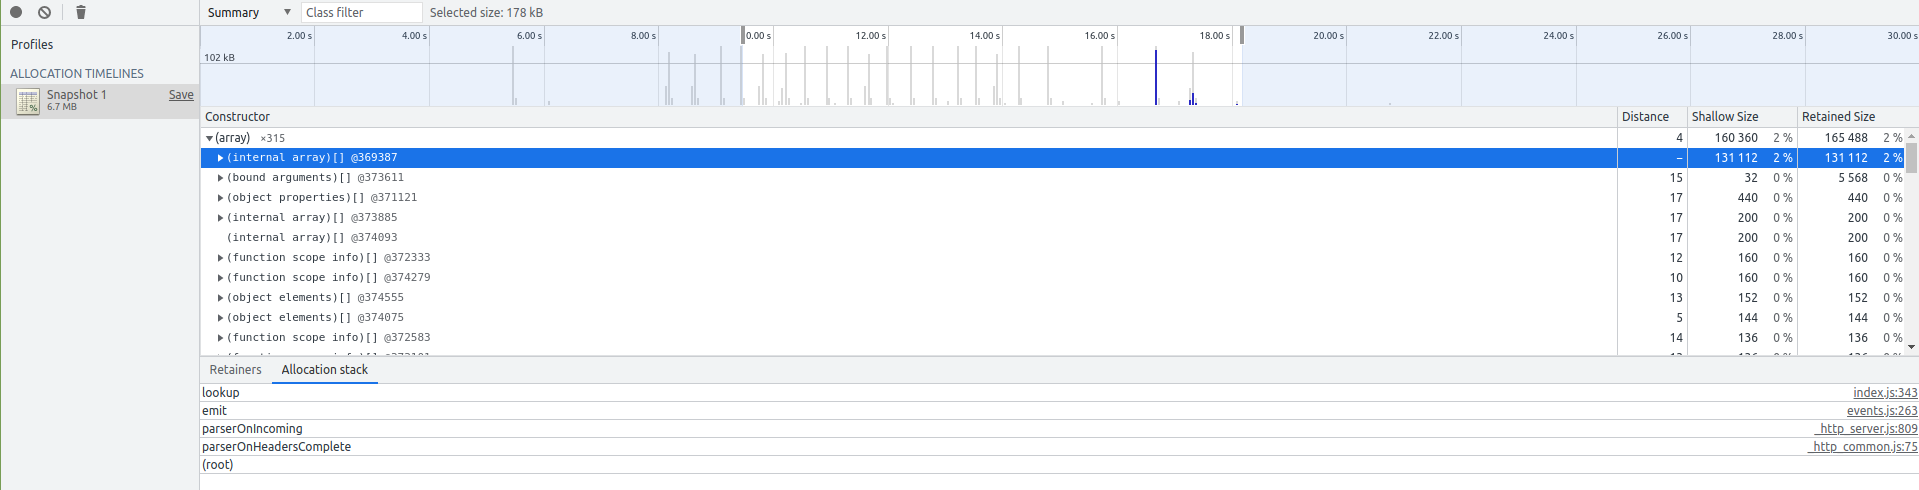
请查看有用链接部分,以获取关于内存术语的更多信息。
🌐 Check the useful links section for further information about memory terminology.
采样堆分析器
🌐 Sampling Heap Profiler
采样堆分析器能够跟踪内存分配模式和随时间变化的保留空间。由于它是基于采样的,其开销足够低,可以在生产系统中使用。
🌐 Sampling Heap Profiler tracks the memory allocation pattern and reserved space over time. Since it is sampling based its overhead is low enough to use in production systems.
你可以使用模块
heap-profiler来以编程方式启动和停止堆分析器。
如何
🌐 How To
启动应用:
🌐 Start the application:
$ node --inspect index.js
--inspect-brk对脚本来说是更好的选择。
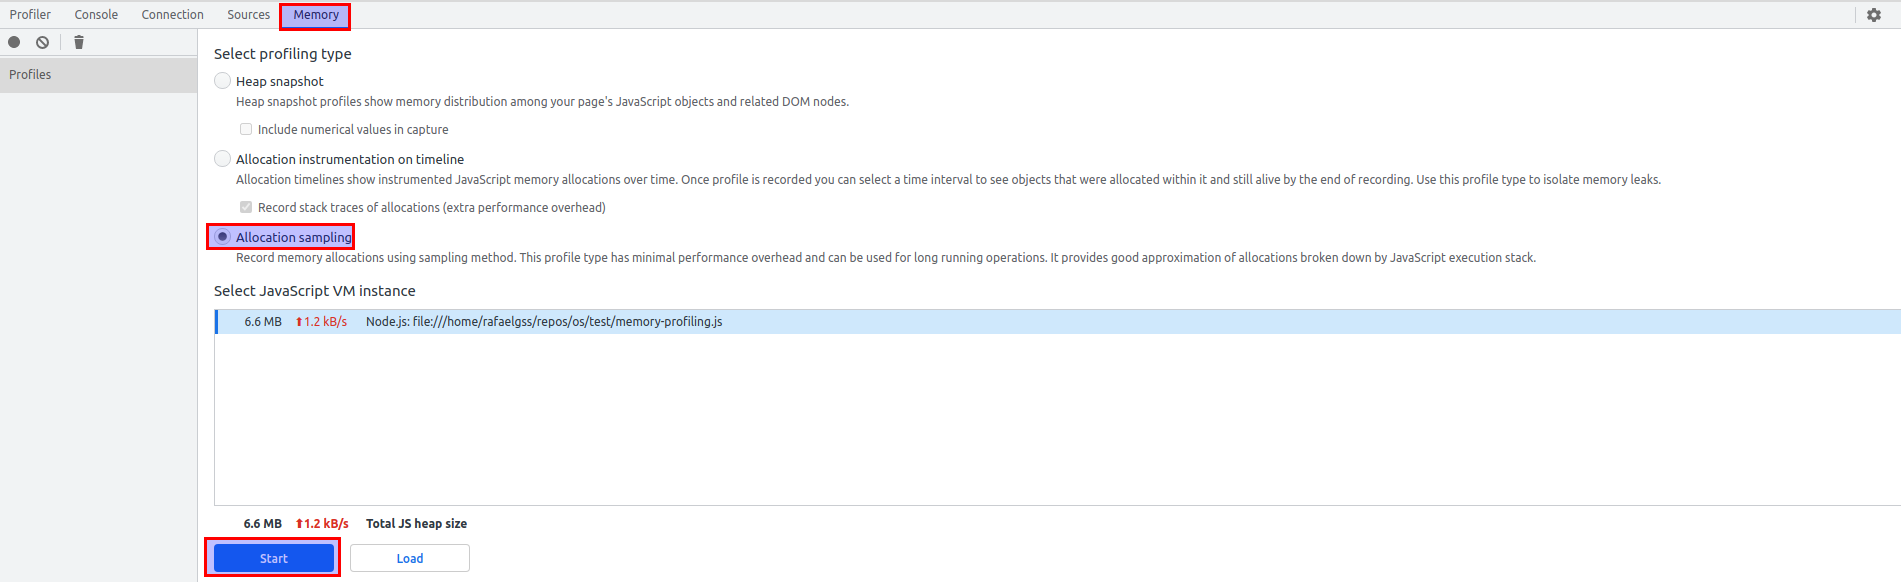
连接到 dev-tools 实例,然后:
🌐 Connect to the dev-tools instance and then:
- 选择
Memory标签。 - 选择
Allocation sampling。 - 开始分析。
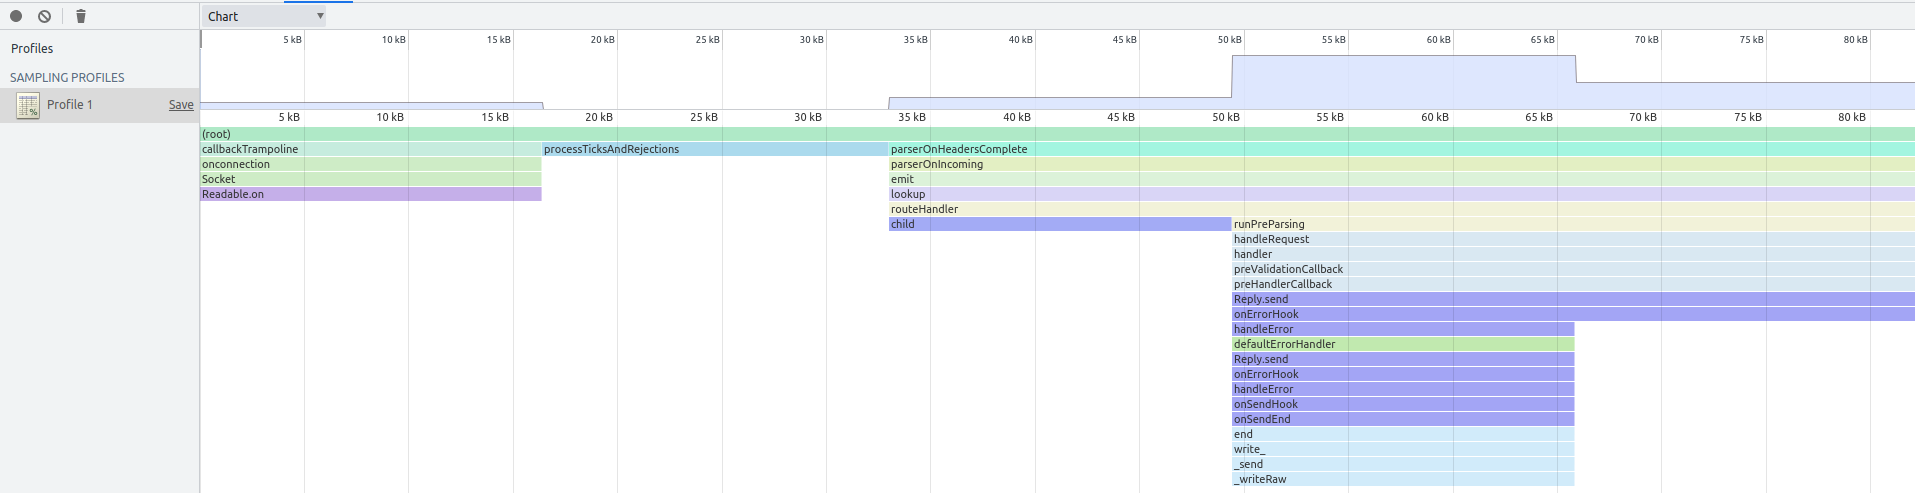
产生一些负载并停止分析器。它会根据堆栈跟踪生成分配摘要。你可以关注堆分配更多的函数,见下面的示例:
🌐 Produce some load and stop the profiler. It will generate a summary with allocation based on their stacktraces. You can focus on the functions with more heap allocations, see the example below:
有用的链接
🌐 Useful Links